Cost Saving Plan
Cost-saving plans estimate the savings you can achieve by utilizing pre-calculated versions of your metrics. You can generate a cost-saving plan for a query audit group with common computation logic: if there is no common computation for a group, you cannot generate a cost-saving plan for that group. Perform this action by choosing the "Generate Cost Saving Plan" action on an audit group's detail page.
NoteNote that cost statistics can only be displayed when the query collection being audited is sourced from a query history table in your warehouse. Cost plans cannot be displayed when the query collection being audited is sourced from a CSV or compliant table.
Run Options
We create a temporary table based on the common computation logic when you generate a cost-saving plan. If you choose the "dry run" option, then:
- we perform a dry run of the original queries in the group that match the common logic
- we perform a dry run of the same queries rewritten to use the common logic (temporary table)
- we then compare the performance of the rewritten queries to the original queries
If you choose the "real run" option, then:
- we run the original queries in the group that match the common logic
- we run the same queries rewritten to use the common logic (temporary table)
- we then compare the performance of the rewritten queries to the original queries
Dry run or real run?A dry run is cheaper in BigQuery since you are not charged for performing a dry run; however, a dry run can only estimates the number of bytes read by the query. Other statistics like query duration are not available
Results
The way to read a row in the "Rewritten queries" table is the following:
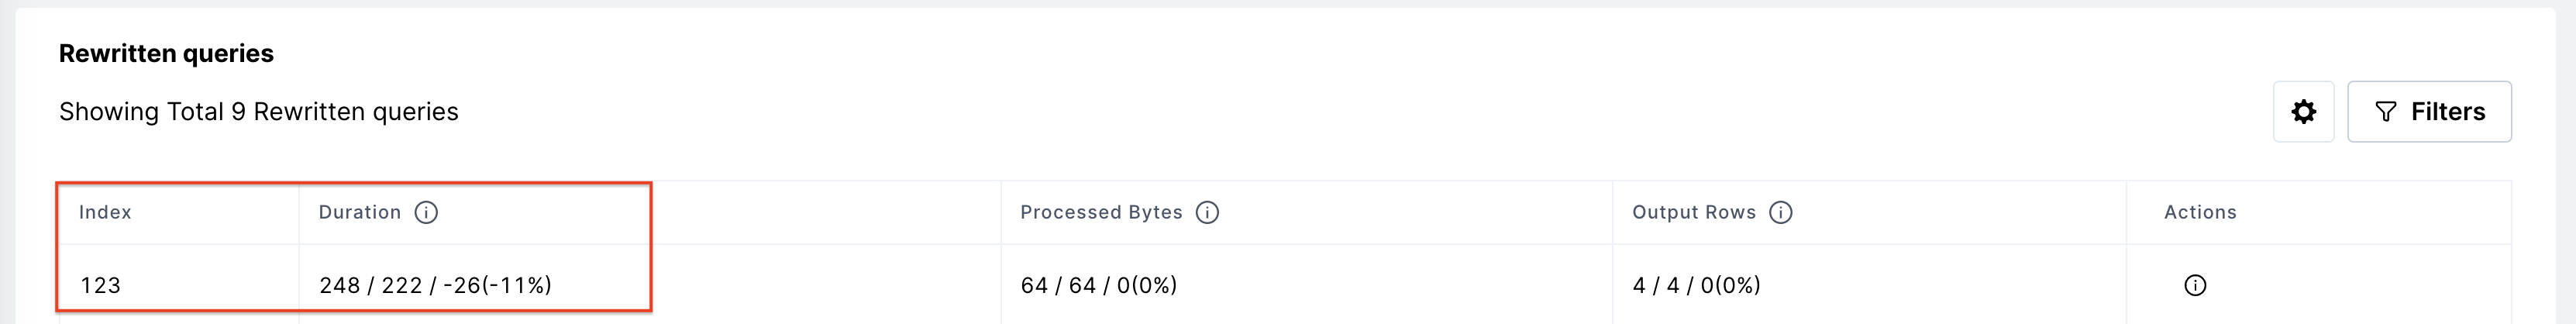
- For the query with index 123 in the query collection that was audited:
- the Duration of the original query was 248 ms
- the Duration of the rewritten query was 222 ms
- the rewritten query was 222 - 248 = -26 ms faster, so the duration of the rewritten query is 11% faster than the duration of the original query
- Processed Bytes and Output Rows are interpreted in the same way as Duration:
- the original query output 4 rows
- the rewritten query output 4 rows
- the rewritten query output 4 - 4 = 0 additional rows, for a change of 0%
The "Savings Summary" stats take the max (average) across the values in each row. For example, if one row has (-10%) and one row has (-6%), then the average across the two rows is -8%. Note that changes between the original and rewritten queries can be noisy for small queries (short duration or few processed bytes).
BigQuery FAQ
- Temporary tables that materialize the common computation logic are stored in a
singleoriginschema that we create in the project you have connected to. - When you perform a "dry run" report, we will only surface the Processed Bytes stat provided by BigQuery - not all stats are available since queries are not executed.
- Why don't I see the option to generate a cost-saving plan for a group?
- If there is no common computation for a group, you cannot generate a cost-saving plan for that group.
Snowflake FAQ
- What permissions does my Single Origin connector need to automatically generate Cost Savings Plans?
- For complete automation, the role you are using for your Single Origin connector will need
ACCOUNTADMINlevel permissions. - If you do not want to give your Single Origin connector will need
ACCOUNTADMINlevel permissions, then you will need to create a Database calledSO_DBand Schema calledSINGLEORIGINin your Snowflake environment. This is where temporary tables that materialize the common computation logic are created during report creation.
- For complete automation, the role you are using for your Single Origin connector will need
- Temporary tables that materialize the common computation logic are stored in a schema called
SO_DB.SINGLEORIGINin the Snowflake environment you connect to. - Why don't I see the option to generate a cost-saving plan for a group?
- If there is no common computation for a group, you cannot generate a cost-saving plan for that goup.
Updated 3 months ago