Insights
https://{tenant}.singleorigin.tech/insight
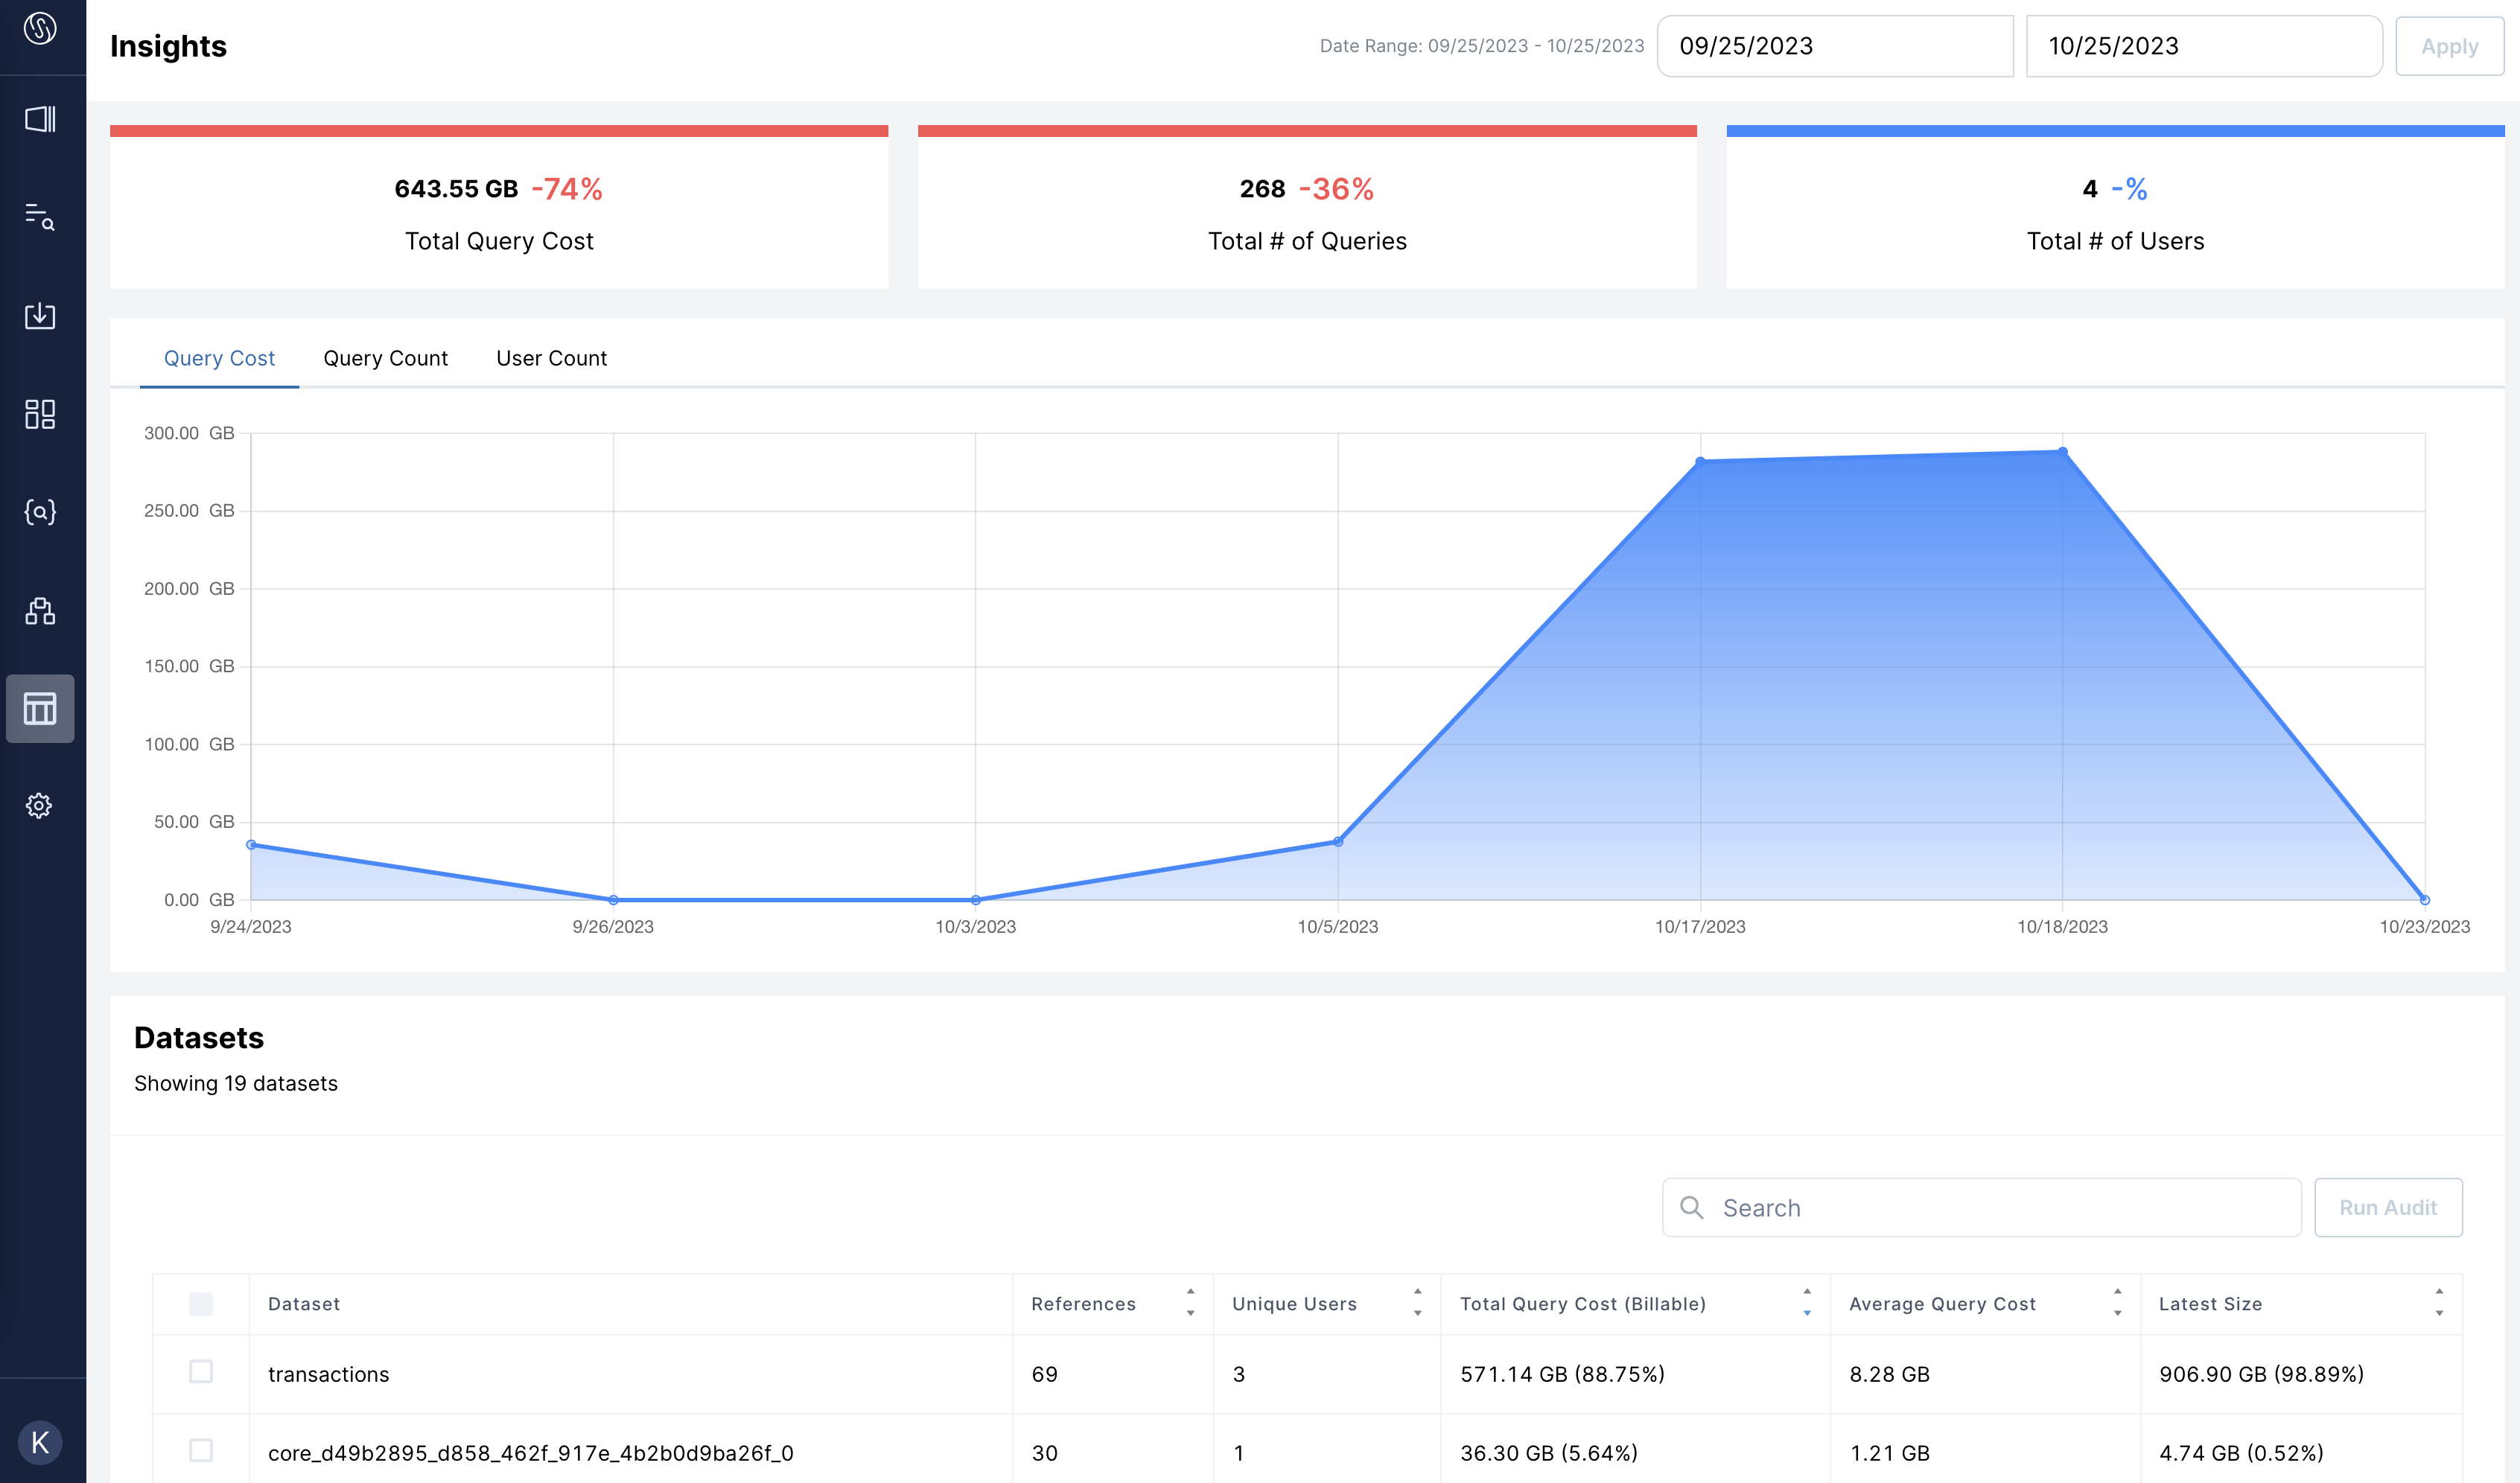
On the Insights page, you can view statistics based on your data warehouse's query logs. All data on the page is based on queries run in the selected time frame.
Insights Page
Summary Stats
Data | Definition |
|---|---|
Total Query Cost | The total cost of running queries in the selected time frame.
|
Total # of Queries | The total number of queries run in the selected time frame. |
Total # of Users | The number of unique users who ran a query in the selected time frame. Since Insights are based on the query logs from your warehouse, the user may not be added to your Single Origin instance yet. |
The % change is relative to the period (of the same length) before the selected time frame. For example, if you choose October 15-28 (14 days), then the period before is October 1-14 (also 14 days).

Summary Stats Insights
Datasets
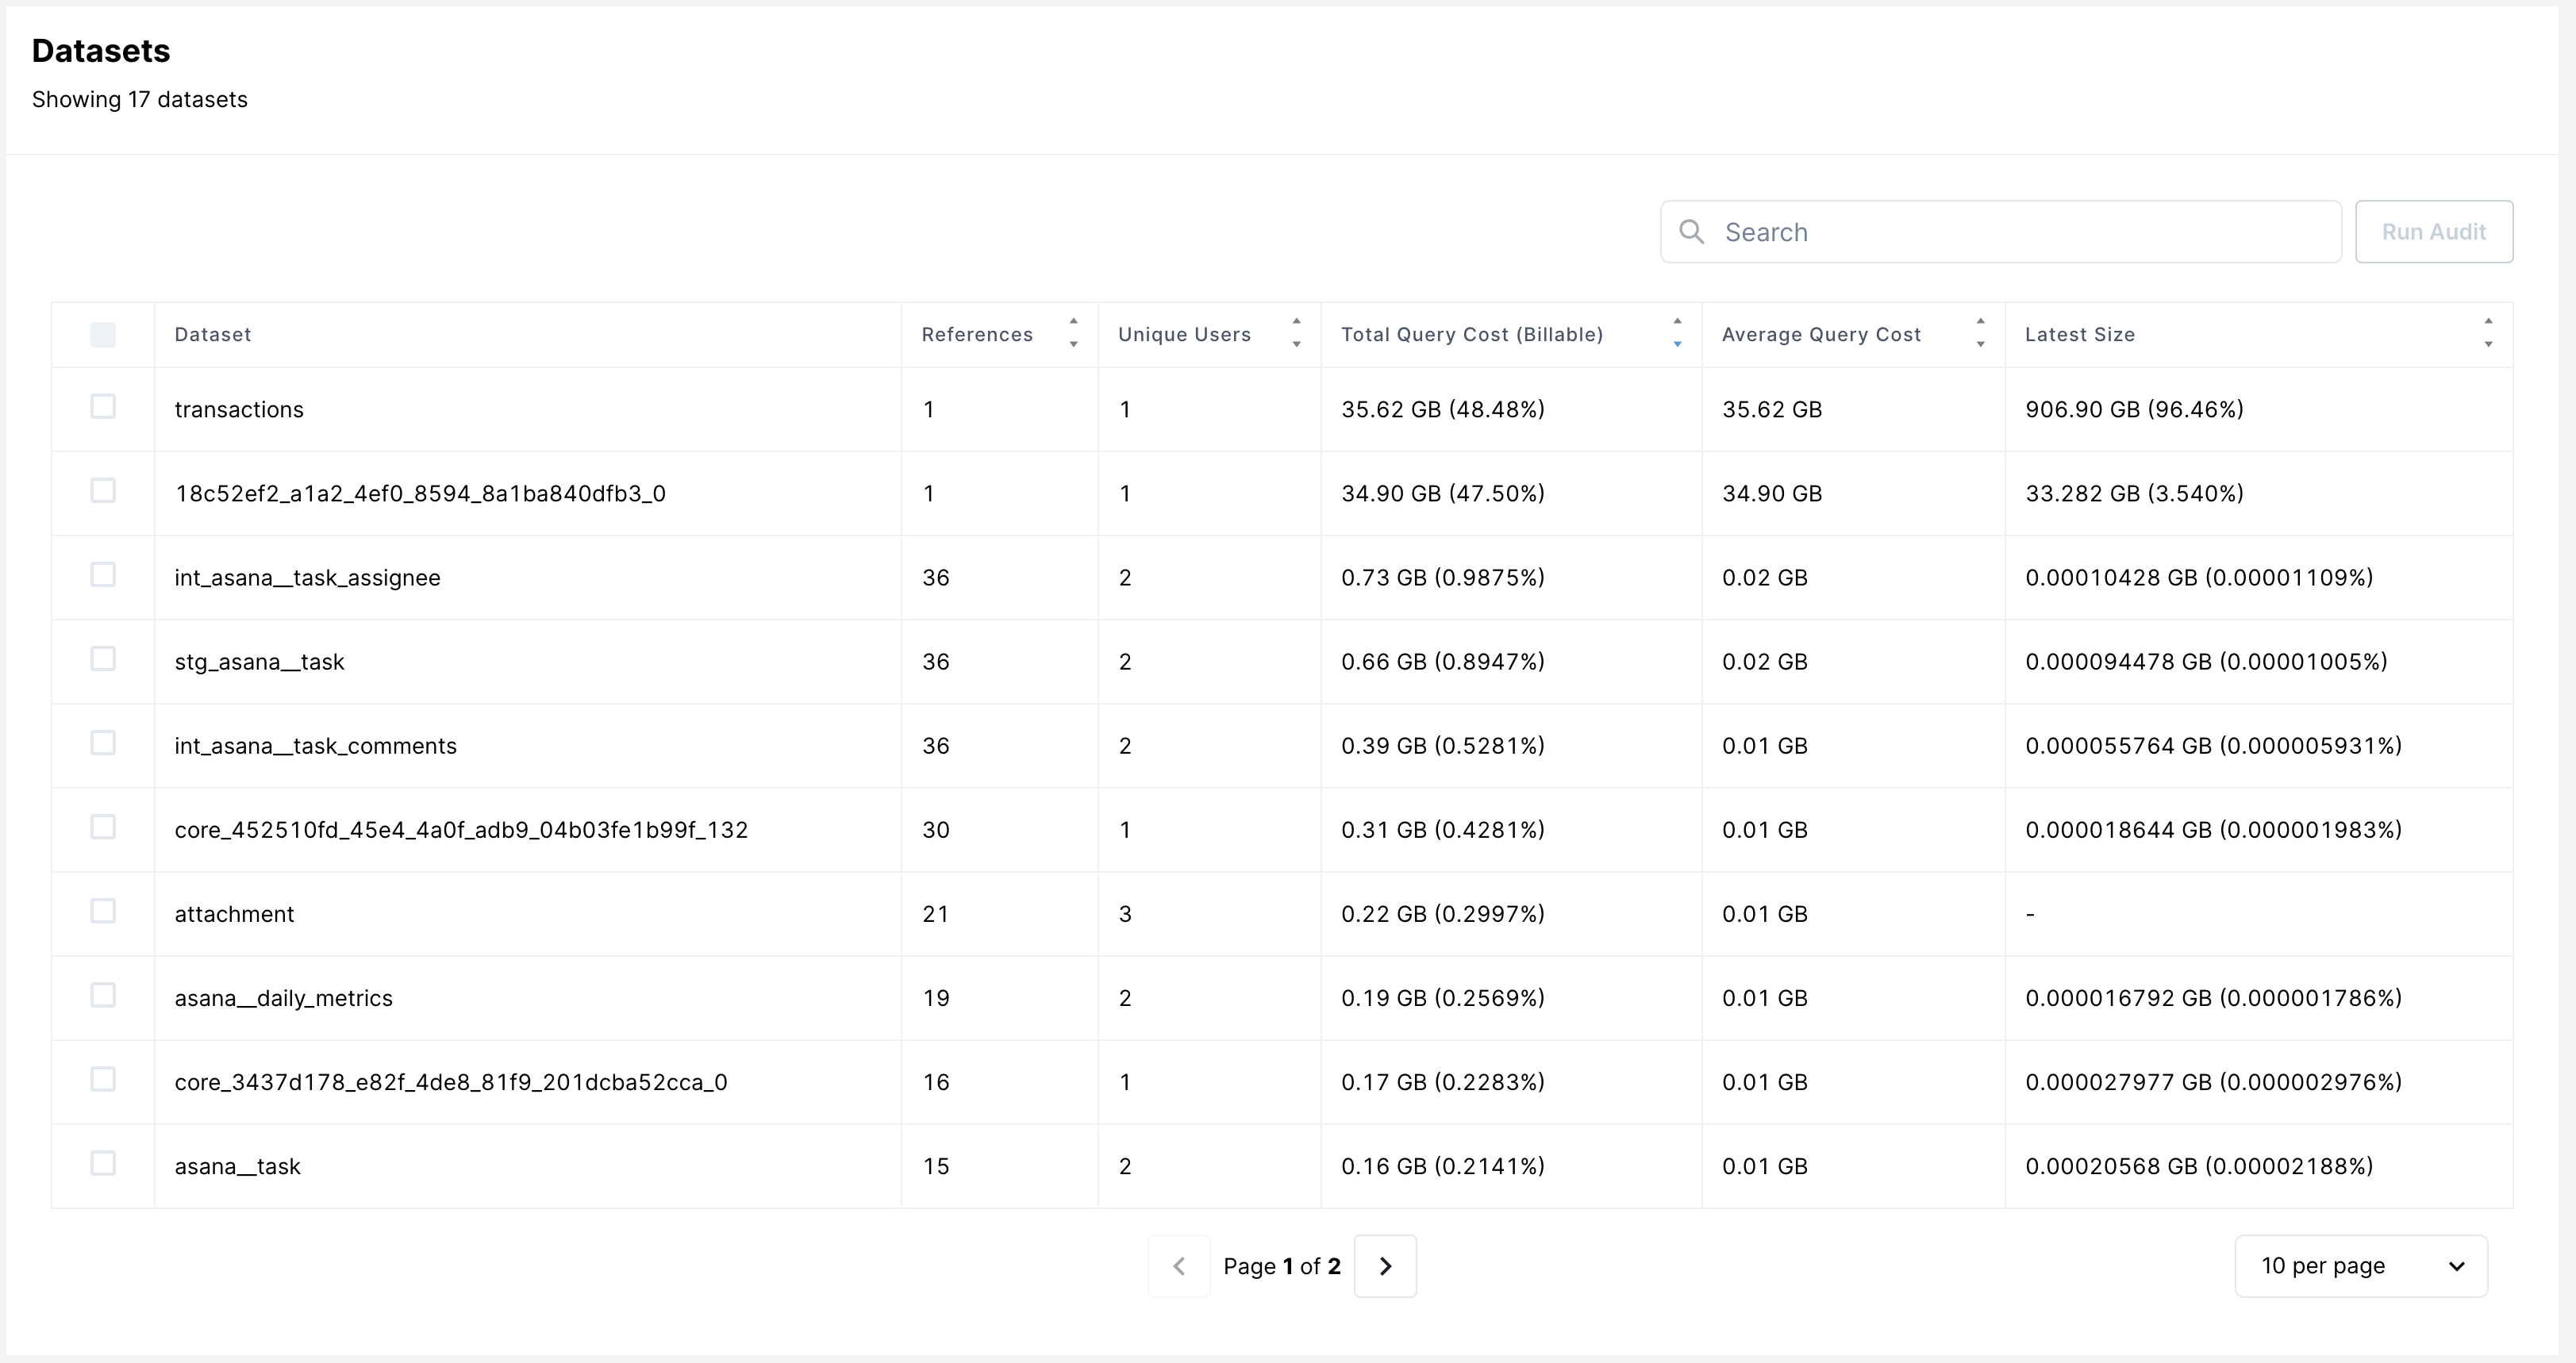
A list of datasets that were queried in the selected time frame.
- References: the number of queries that referenced the table
- Unique Users: the number of users that queried the table
- Total Query Cost: the total cost of queries against the table
- Average Query Cost: Total Query Cost/References
- Latest Size: the current storage size of a dataset based on metadata provided by the warehouse
In the "Datasets" table, you can choose a dataset and click "Run Audit" to create an Audit (along with the corresponding Collection) of all queries referencing the dataset over the selected time frame.
Datasets Insights
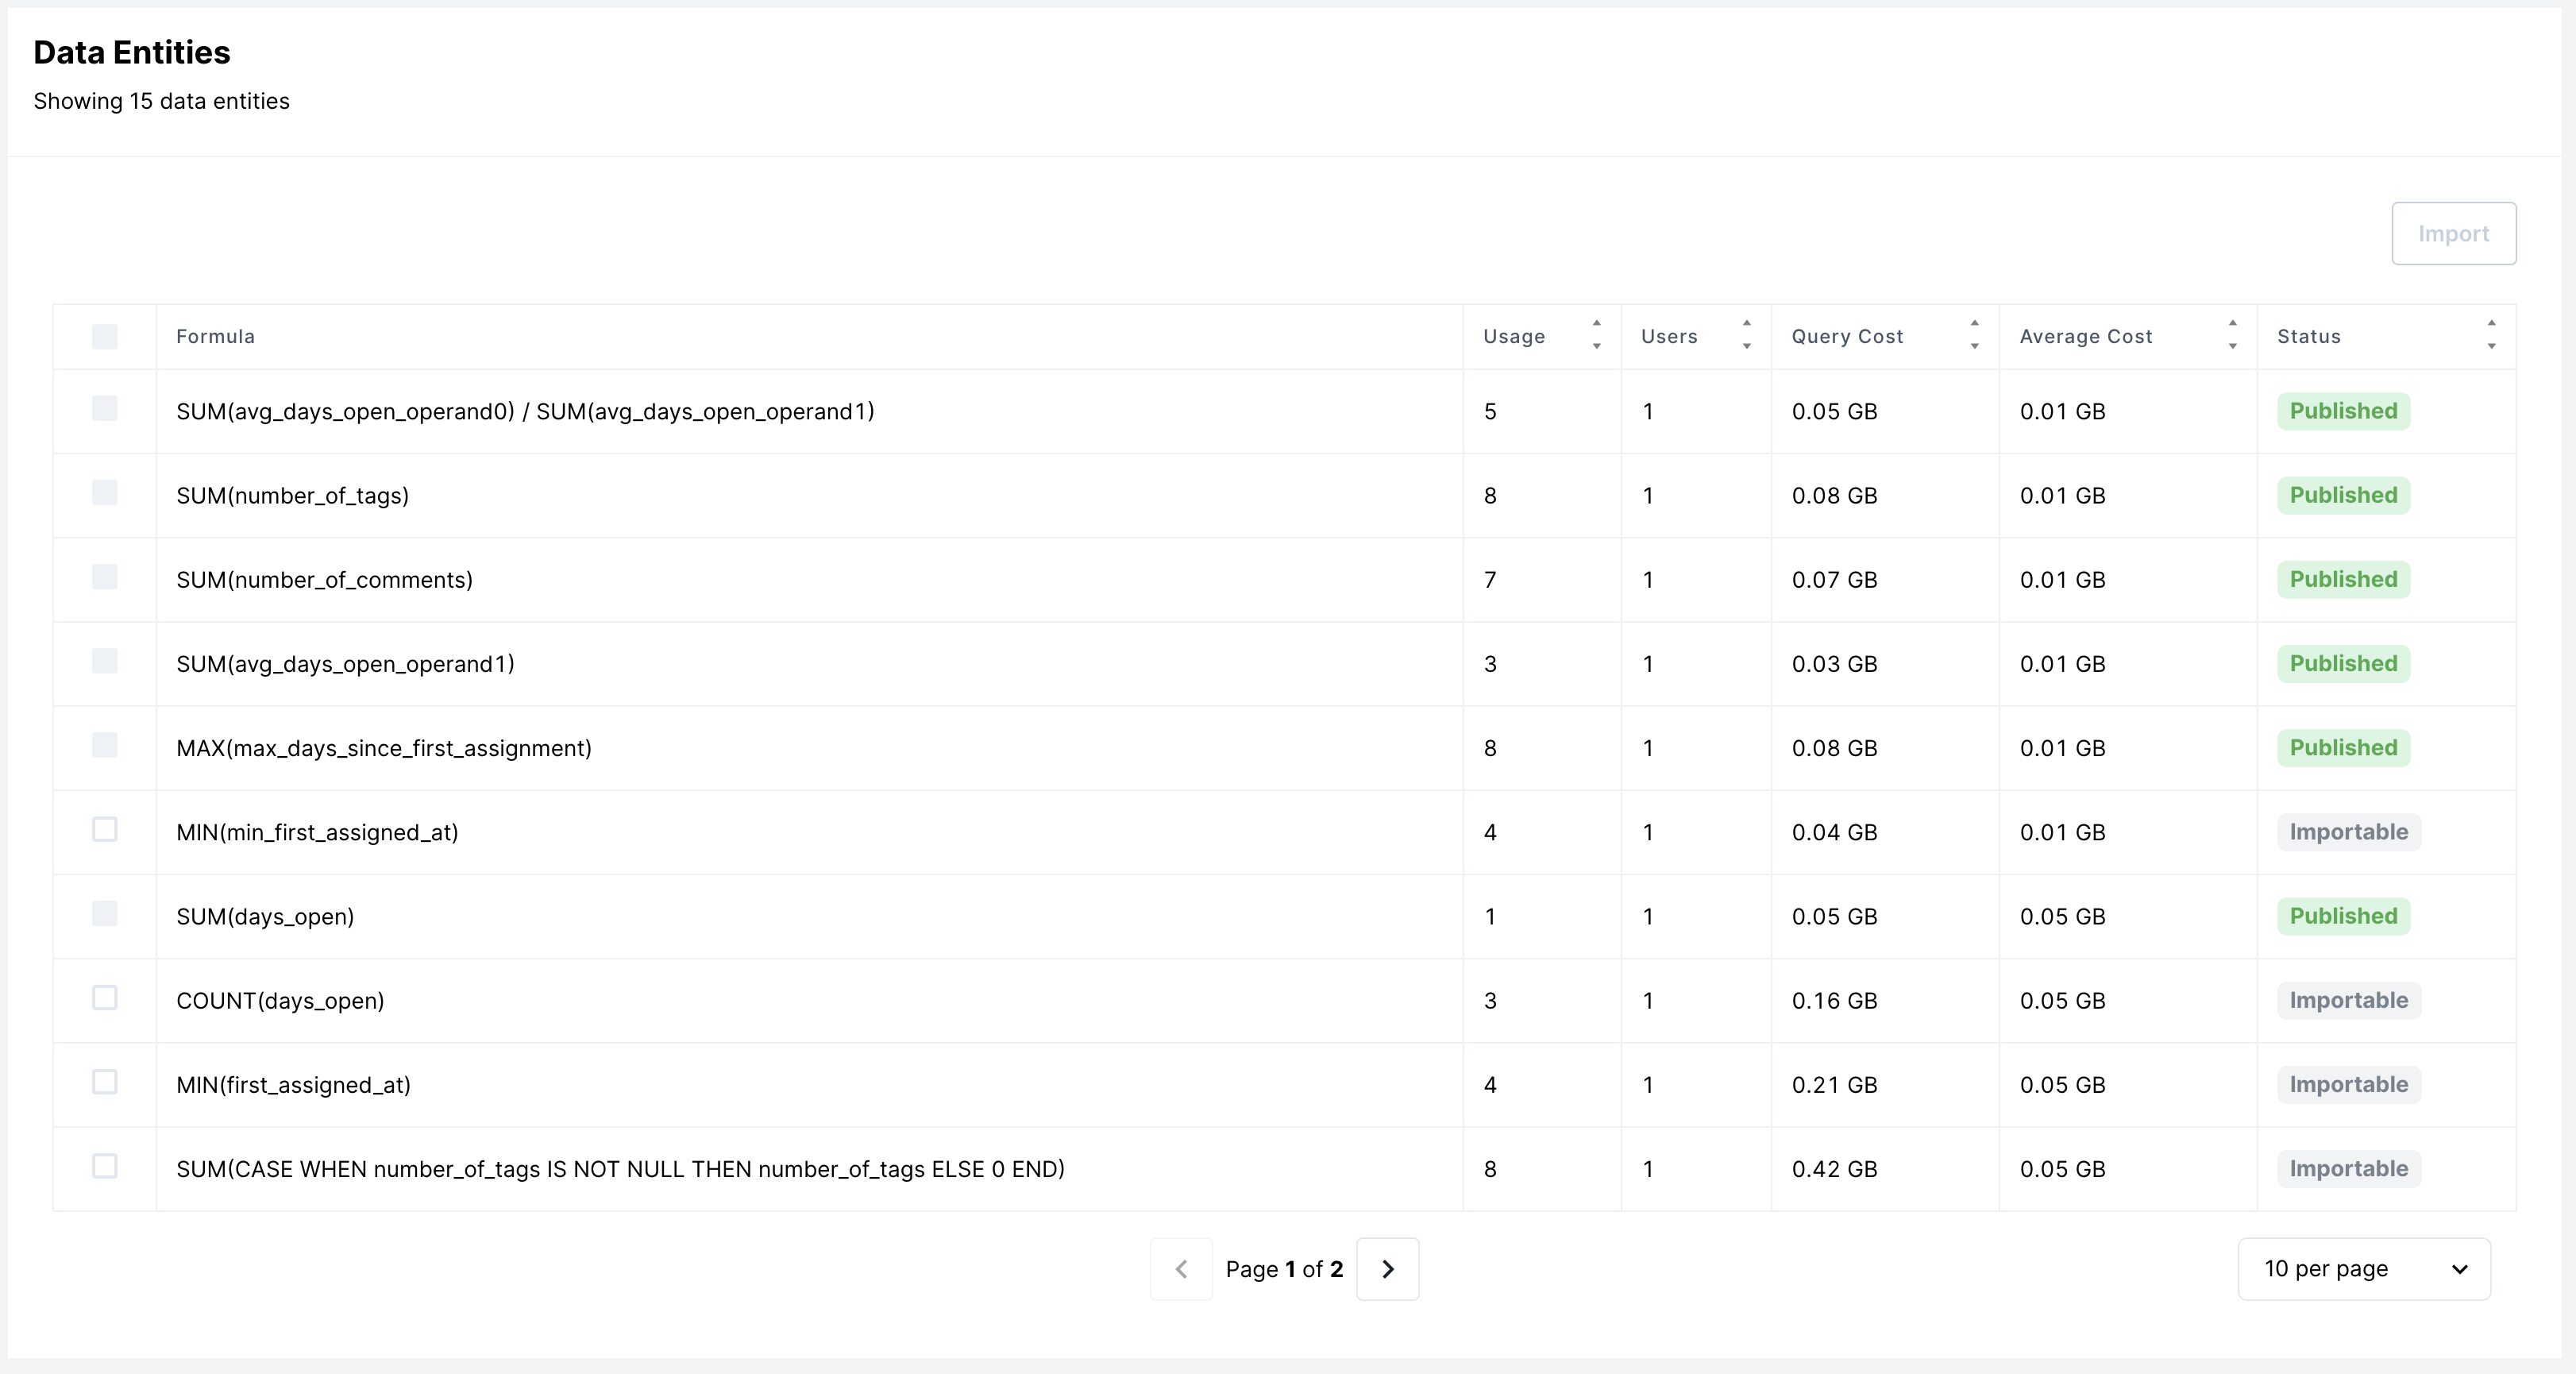
Data Entities
A list of formulas (data entities) that were queried in the selected time frame.
- Usage: the number of queries that use the formula with the same semantics
- Users: the number of users that queried the formula
- Query Cost: the cost of running the query that contains the formula
- Average Cost: Query Cost/Usage
- Status: does the underlying formula (semantics) already exist as a data entity in your Catalog? If so, then status =
Published; if not, then status =Importable.
In the "Data Entities" table, you can choose a data entity and click "Import" to import the expression (and its corresponding view) as a data entity in your .Catalog. To learn more about entities, see this page.
Data Entity Insights
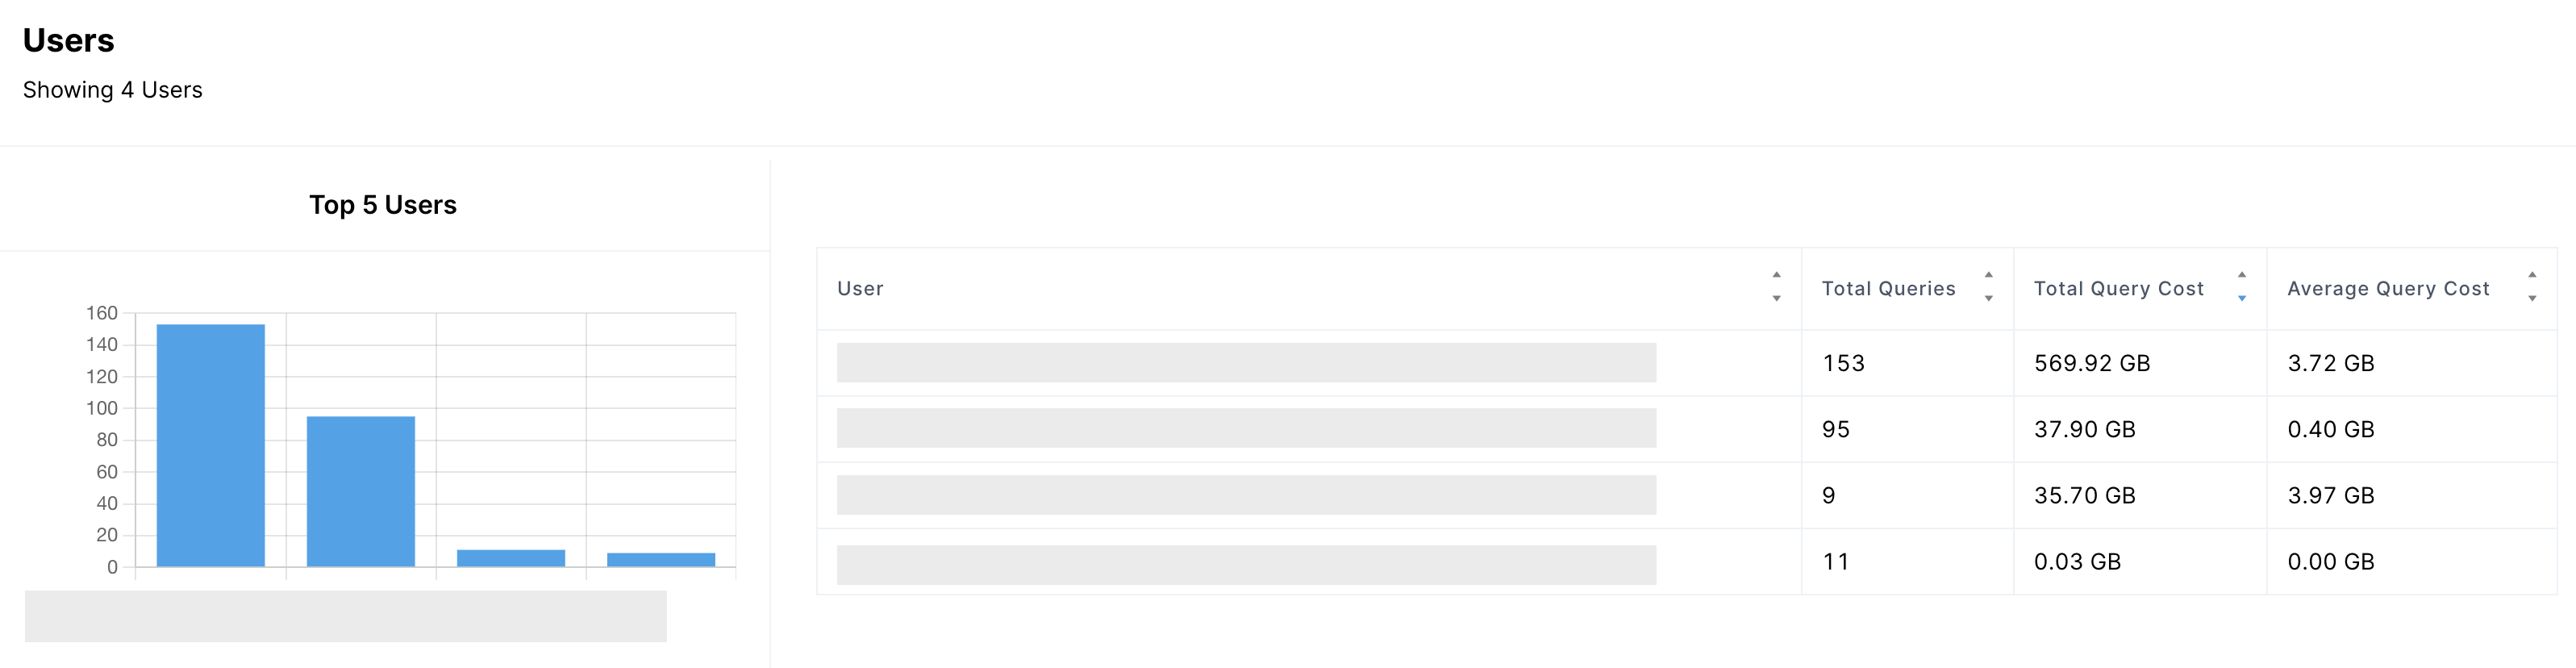
Users
A list of users that ran queries in the selected time frame.
- User: the user identifier that ran the query. The identifier comes from the underlying warehouse.
- Total Queries: the number of queries run by the user
- Total Query Cost: the total cost of queries run by the user.
- Average Query Cost: Total Query Cost/Total Queries
User Insights
Query Savings Patterns
A list of selected query patterns that you may be able to optimize and generate significant cost savings. A query pattern is defined as a set of datasets joined in a specific way.
- Source Dataset: the datasets referenced by the query pattern
- Unique Users: the number of users that queried the pattern
- Query Count: the number of times the pattern was queried
- Total Cost: the total cost of the queries using the pattern
- Common SQL: see Common Computation
In the "Query Savings Patterns" table, you can choose a pattern and click "Run Audit" to create an Audit (along with the corresponding Collection) of all queries matching the pattern over the selected time frame.
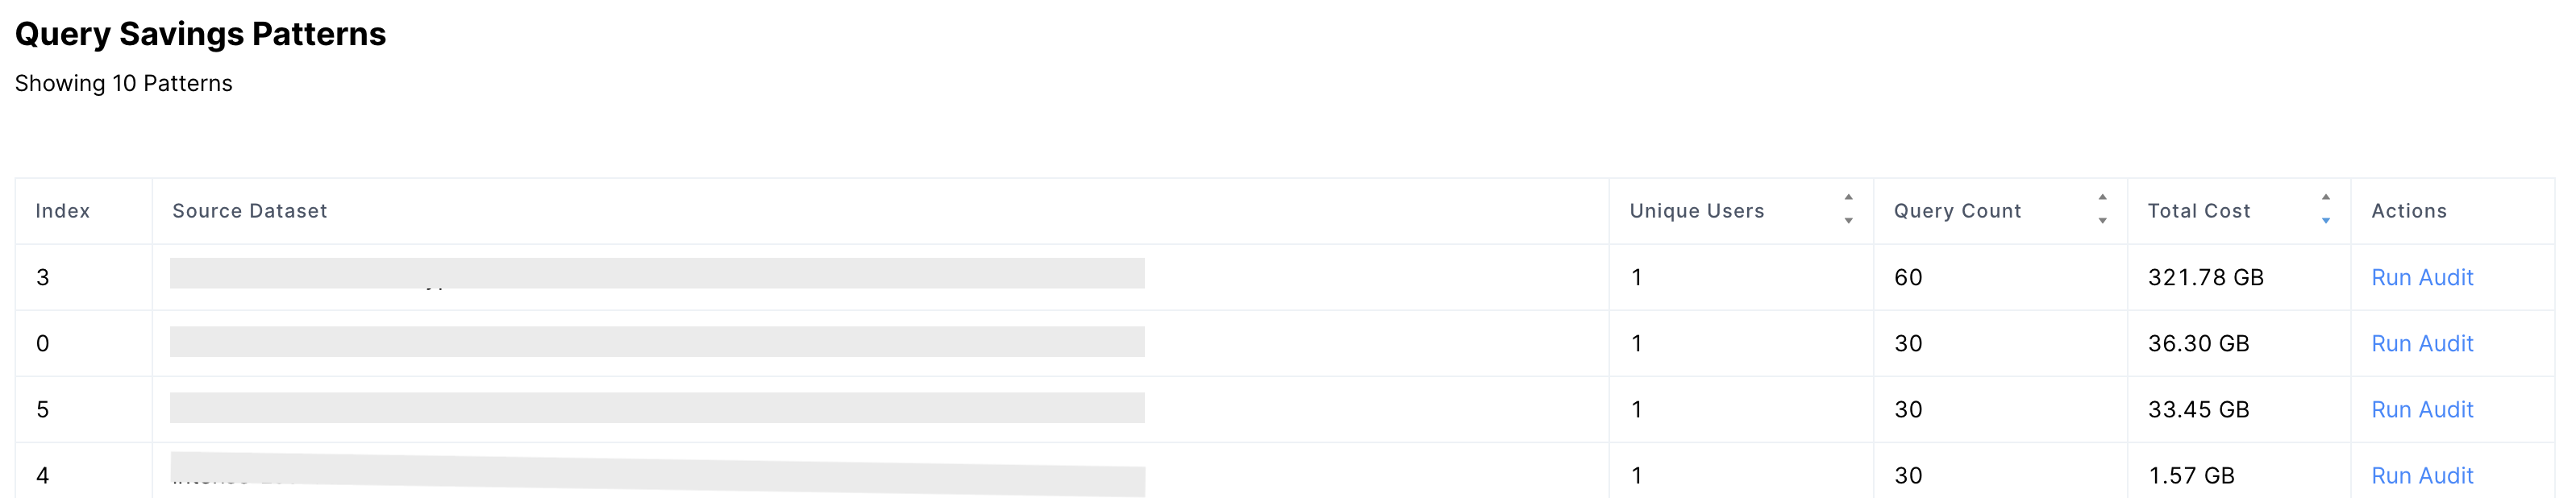
Query Pattern Insights
FAQ
- Why is a particular dataset not appearing on the Insights page?
- If a dataset is not queried in the time range, it will not appear in the table.
- What does the "Published" status mean for a formula in the "Data Entities" table?
- It means the underlying formula (semantics) already exists as a data entity in your Catalog. Thus, you do not need to import the formula.
- How do you calculate the cost of querying a particular dataset?
- We start with the query cost logged in your warehouse's query logs. We then distribute the total query cost among the datasets referenced based on the size of each dataset.
- For example, suppose one query references tables
AandBand scans 1 GB of data. Then if tableAis 3x as large as tableB, we will allocate 0.75 GB of the query cost to tableAand 0.25 GB of the query cost to tableB.
Updated 3 months ago