
Tables
See which tables cost the most to read and write, and which ones are waste.
The Tables page ranks your tables by what queries spend reading and writing them. Use it to find tables where one change (a cluster key, a better filter, a shared summary table, or dropping the table) helps every job that uses it.
Find tables to look at
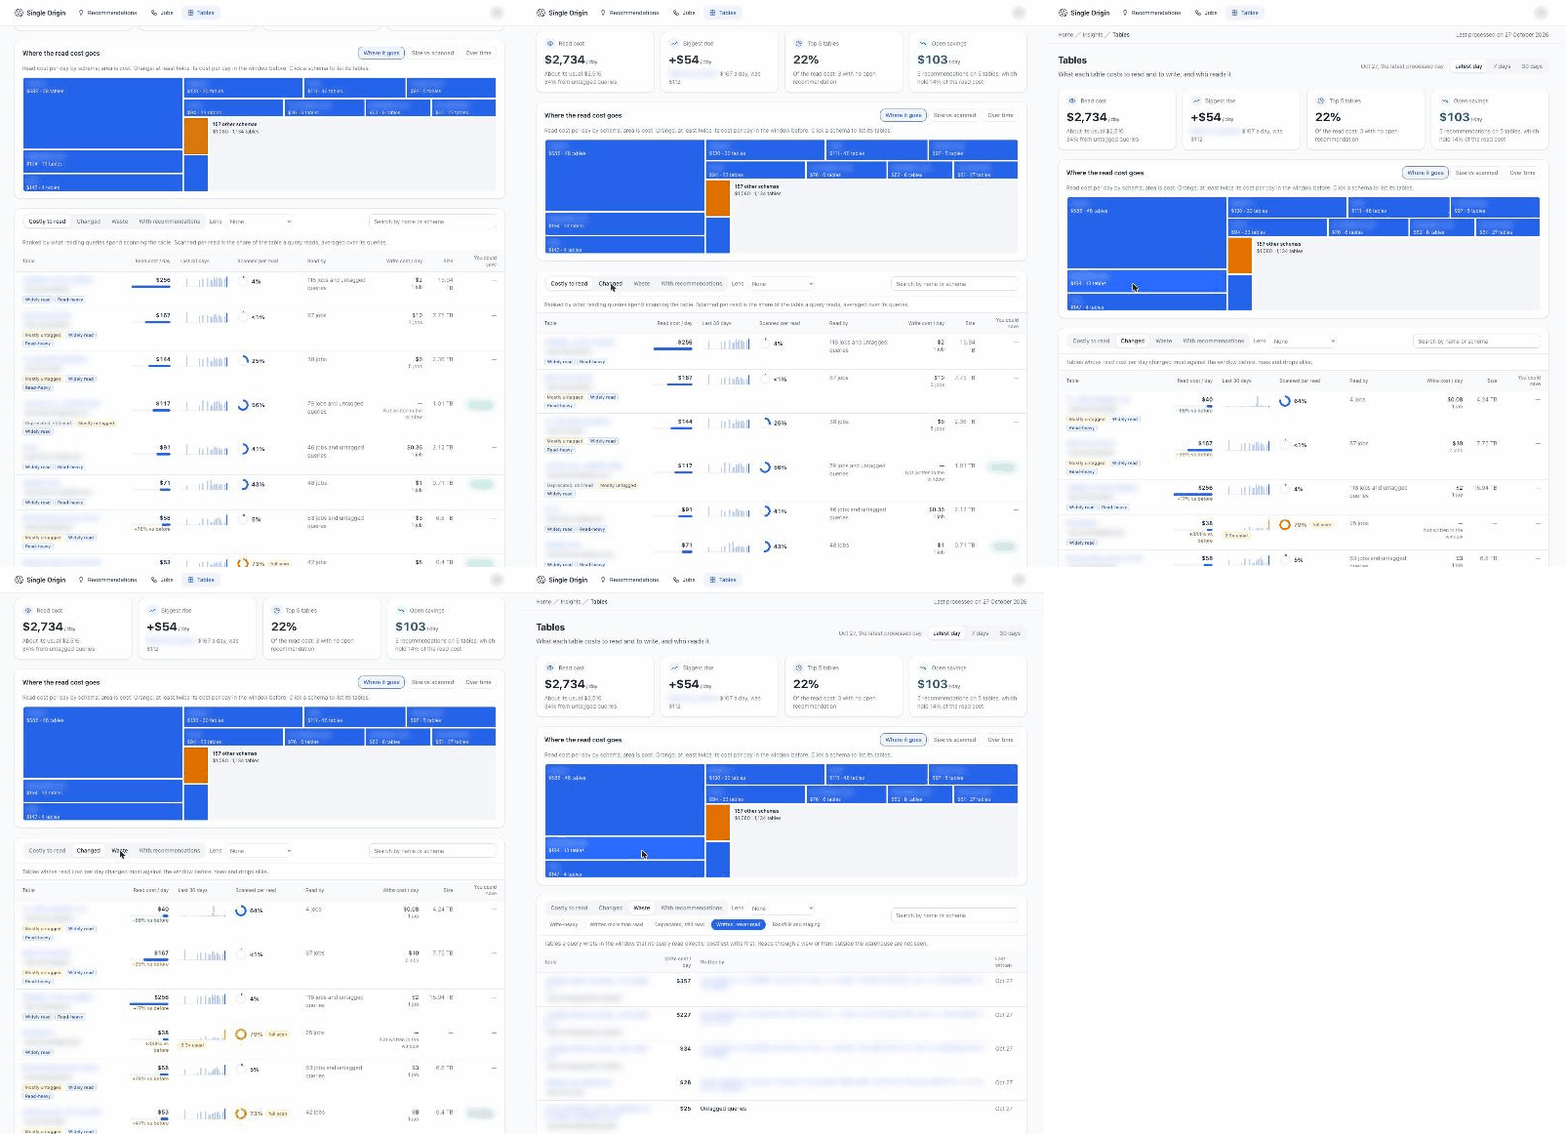
Example workspace. Names are blurred and figures are illustrative.
Pick a period: Latest day, 7 days or 30 days. The summary shows Read cost, the biggest rise, and Open savings on tables with an open recommendation.
The charts show Where it goes (read cost by schema), Over time (read cost per day) and Size vs scanned (large tables most reads scan nearly in full).
The list has four tabs:
| Tab | What's in it |
|---|---|
| Costly to read | Tables ranked by what reading queries spend scanning them. |
| Changed | Tables whose read cost per day changed most against the period before. |
| Waste | Tables that cost money for little use. Pick a view, listed below. |
| With recommendations | Tables an open recommendation targets, largest savings first. |
The Waste tab has these views:
| View | What it finds |
|---|---|
| Written, never read | Tables a query wrote in the period that no query read directly. Reads through a view or from outside the warehouse are not seen. |
| Written more than read | Tables written at least 10 times as often as they are read. |
| Write-heavy | Tables that cost at least 10 times more to write than to read. |
| Deprecated, still read | Tables whose name marks them deprecated or a backup, but that queries still read. |
| Backfills and staging | Date-stamped and temporary tables written in the period, grouped by name. |
The Lens menu narrows the list further:
| Lens | What it finds |
|---|---|
| Full scans | Tables of 1 TiB or more whose reads scan 90% of the table or more. |
| No recommendation | Tables with read cost that no open recommendation names. |
| Widely read | Tables 10 or more jobs read. |
| Mostly untagged | Tables where at least half the read cost comes from queries without a job tag. |
| Filter columns | The columns reading queries filter each table on most. The top one is the first candidate for a cluster key. |
| Read-heavy | Tables that cost at least 10 times more to read than to write. A cluster key or a smaller shared table pays off here. |
| Written through the Hive SerDe | Spark only. Tables whose writes kept executors up after the last task. |
Search the list by name or schema.
Read a table
Click a table to open its page. About this table shows:
- a summary: Read cost, Write cost, Reads, Writes, Scanned per read and Open savings;
- recommendations that change the table or the jobs that read or write it, Open and Applied;
- Jobs that read it, with cost per day and how much of the table each scans, and a Read cost by reader chart;
- Do the filters prune?: the costliest readers' filter columns against the table's cluster key;
- How it is written: the jobs that write it, with their SQL;
- Tables built like this one: tables whose build logic matches, labelled Duplicate, Rollup, Filtered variant, Subset, Same logic, other sources, Same logic, other joins or Partial overlap. On engines without parsed SQL, matches come from the execution plan instead.
Explore a period shows the same detail for a date range you pick.
From your AI assistant
Over MCP, your agent can resolve a table, read its metadata and producers, its scan cost and similar tables. See Understand a table.
Related
Updated about 6 hours ago